Business intelligence analyst resume examples and templates
A business intelligence analyst resume can explain why a reported number is trustworthy and how people use it. Show the rule behind a shared measure, the checks behind its totals and the evidence of dashboard adoption. This complete example follows recurring service reporting from definition to a weekly operations meeting.
Choose a business intelligence analyst resume design
These previews use the same layouts as the builder, with identical example content. Open a full preview to inspect the text and spacing.
Fictional candidate, employers, education and results. The optional portrait is AI-generated. Use your own evidence and photo; the example is not inserted into your resume.
Precision
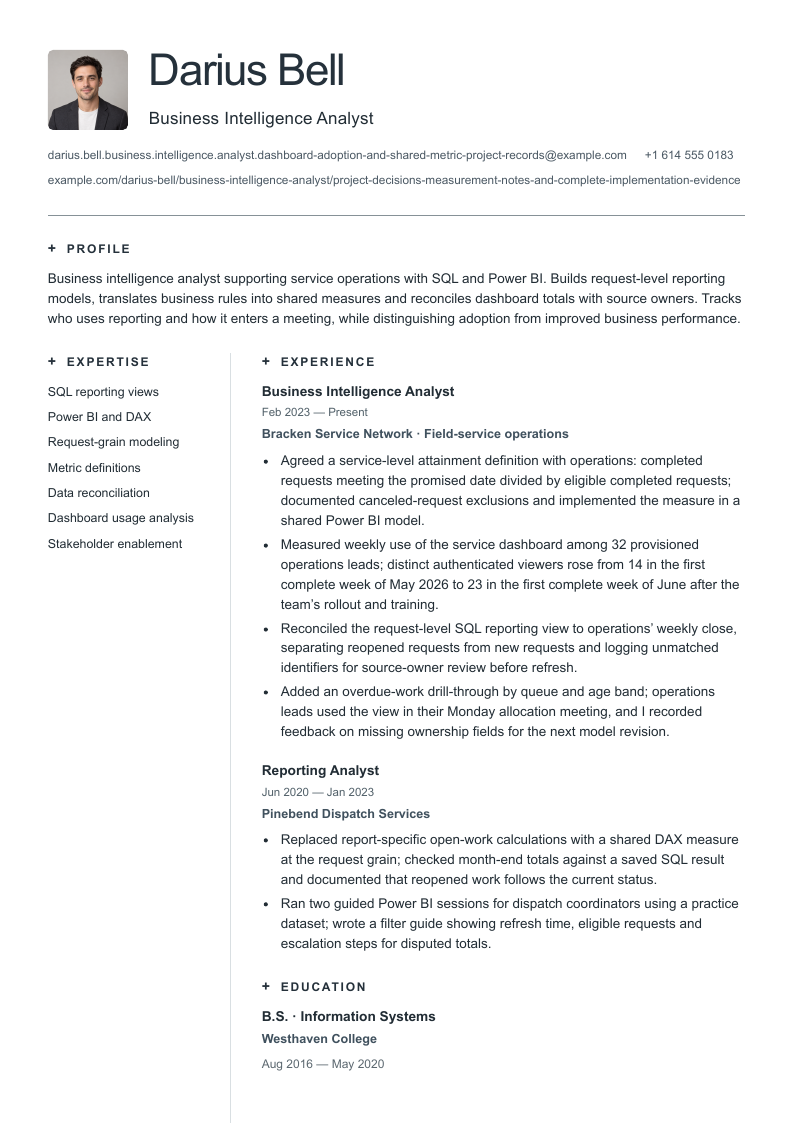
An open header and full-width profile lead into a compact skills column beside the wider experience, education and projects column.
Before sending: The narrow skills rail is useful for a short evidence-backed list. Check its reading order and the shared-model project across all exported pages.
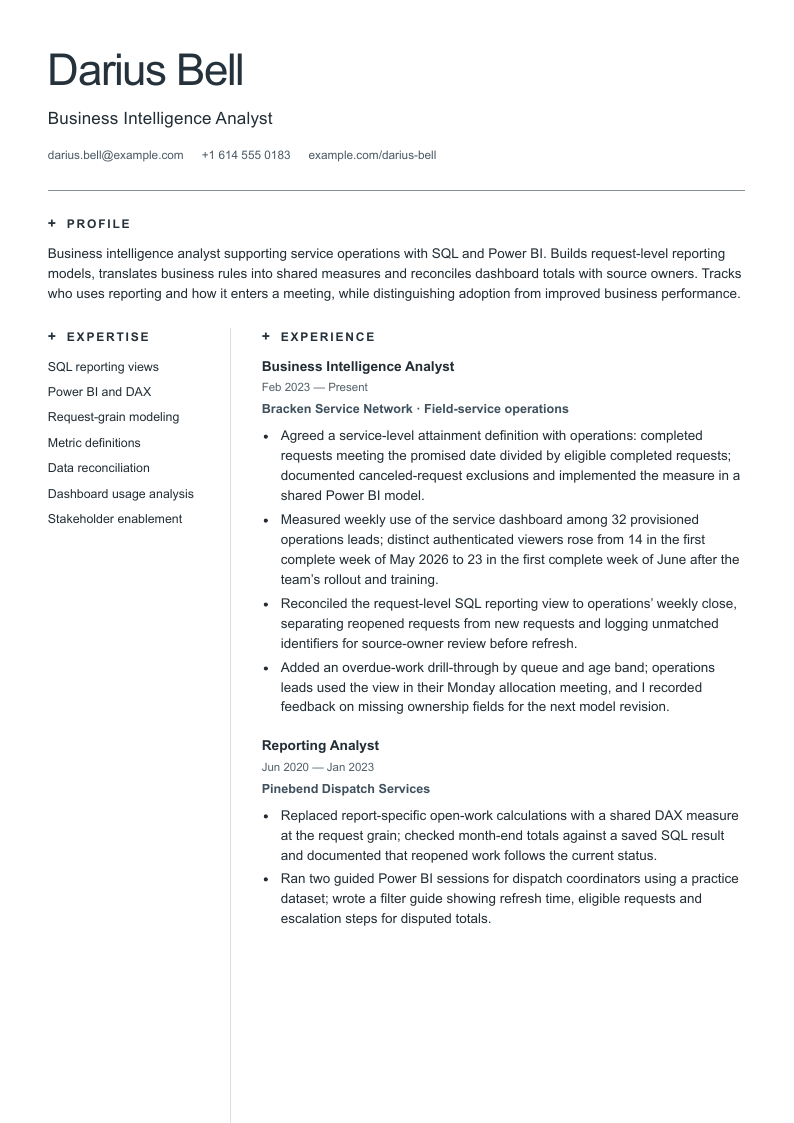
A plain left header and single-column sequence put the metric definition and usage comparison into one continuous work-history narrative.
Before sending: Long calculation wording occupies more vertical space. Preserve the denominator and exclusions before trying to shorten a bullet for appearance.
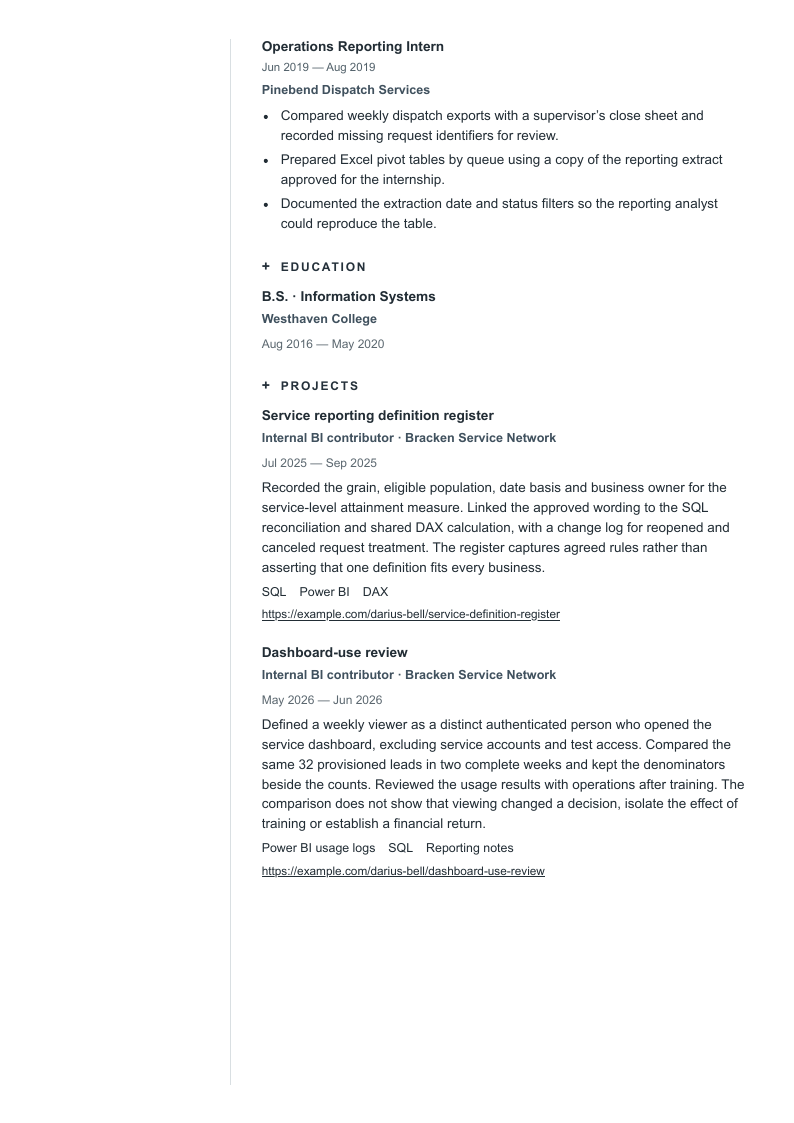
An unfilled left column holds projects, skills and qualifications; the wider right column holds the summary and work history.
Before sending: The model-definition project sits in a narrow column. Inspect URL wrapping, continuation pages and copied text order with your actual record.
“Use” opens signup with that design and photo preference selected for the builder. A free account is required. Free-plan PDF downloads include a watermark; see current plans for paid options. Photo conventions vary; follow the employer’s instructions and local expectations.
Precision, Essential and Clarity present exactly the same Darius Bell record. The full previews include every PDF page; switch the optional photo on or off to inspect contacts and the identity area. No photo is selected by default. The fictional portrait is a layout example and is not added to your resume.
Precision puts skills in a compact column beside the wider work history. Essential uses a single body column with restrained headings and date gutters. Clarity gives projects and qualifications a left column. Compare the complete calculation wording, dates and project links before choosing; none of these designs guarantees parsing in every application system.
A complete business intelligence analyst resume example
Darius Bell is a fictional reporting analyst who moved into business intelligence for a service network. All names, employers, qualifications, work and results are invented teaching material. Portfolio and project URLs use example.com as placeholders. The record demonstrates reporting work; it should not become a set of borrowed claims on your application.
Business intelligence analyst supporting service operations with SQL and Power BI. Builds request-level reporting models, translates business rules into shared measures and reconciles dashboard totals with source owners. Tracks who uses reporting and how it enters a meeting, while distinguishing adoption from improved business performance.
Skills
SQL reporting views · Power BI and DAX · Request-grain modeling · Metric definitions · Data reconciliation · Dashboard usage analysis · Stakeholder enablement
Experience
Business Intelligence Analyst
Bracken Service Network · Field-service operations
February 2023–Present
Agreed a service-level attainment definition with operations: completed requests meeting the promised date divided by eligible completed requests; documented canceled-request exclusions and implemented the measure in a shared Power BI model.
Measured weekly use of the service dashboard among 32 provisioned operations leads; distinct authenticated viewers rose from 14 in the first complete week of May 2026 to 23 in the first complete week of June after the team’s rollout and training.
Reconciled the request-level SQL reporting view to operations’ weekly close, separating reopened requests from new requests and logging unmatched identifiers for source-owner review before refresh.
Added an overdue-work drill-through by queue and age band; operations leads used the view in their Monday allocation meeting, and I recorded feedback on missing ownership fields for the next model revision.
Reporting Analyst
Pinebend Dispatch Services
June 2020–January 2023
Replaced report-specific open-work calculations with a shared DAX measure at the request grain; checked month-end totals against a saved SQL result and documented that reopened work follows the current status.
Ran two guided Power BI sessions for dispatch coordinators using a practice dataset; wrote a filter guide showing refresh time, eligible requests and escalation steps for disputed totals.
Education
B.S. in Information Systems · Westhaven College
August 2016–May 2020
Projects
Service reporting definition register
Internal BI contributor · Bracken Service Network
July 2025–September 2025
SQL · Power BI · DAX
Recorded the grain, eligible population, date basis and business owner for the service-level attainment measure. Linked the approved wording to the SQL reconciliation and shared DAX calculation, with a change log for reopened and canceled request treatment. The register captures agreed rules rather than asserting that one definition fits every business.
The record links one service measure to its business owner, a request-level model, a reconciliation check and a defined audience. The project preserves the rule behind the dashboard. This emphasis on repeatable reporting and adoption is distinct from the broader data analyst guide; predictive modeling is not needed to make this example credible.
Make metric definitions and dashboard use inspectable
A metric name alone can conceal several different calculations. Explain the grain, eligible population and date basis. For a rate, keep the numerator and denominator together; say how cancellations, reopened items or missing dates are treated. The sample’s service-level attainment divides eligible completed requests that met their promised date by all eligible completed requests. Operations approves the rule; the analyst implements and checks it.
Consistent definitions do not require a claim that you governed every company metric. A shared measure with an approved change log is a specific contribution. If you owned requirements but another team built the model, say so. If you wrote the SQL and DAX, name the model and checks without claiming ownership of the warehouse or every upstream source.
Adoption also needs a definition. Darius counts distinct authenticated weekly viewers, excluding service and test accounts, within the same 32 provisioned operations leads. Fourteen to 23 viewers is nine additional people, roughly 44% to 72% of the eligible group, an increase of about 28 percentage points. It is not 28% more people, and it is not proof of higher productivity.
A dashboard view can be accidental or passive. Pair usage counts with an observable use, such as a team opening the overdue-work drill-through during allocation. Keep training attendance, report views, decisions and business results separate in your notes. A rollout followed by higher use cannot isolate training’s effect, and meeting use does not establish that the report reduced overdue work. Report those further outcomes only when you have suitable evidence.
When data is confidential, describe the approved scope, rule and validation method without publishing records or inventing substitute business results. A portfolio based on synthetic data is useful if clearly labeled; it is a demonstration of method, not evidence of a real employer’s adoption.
Six annotated business intelligence bullet rewrites
All six “after” statements appear in the complete resume. They distinguish implementation, reconciliation, adoption and enablement so the reader can tell what the analyst contributed. Use the evidence prompts to reconstruct your own work before selecting a number.
A definition that survives a dashboard change
Before: Standardized all company KPIs.
After: Agreed a service-level attainment definition with operations: completed requests meeting the promised date divided by eligible completed requests; documented canceled-request exclusions and implemented the measure in a shared Power BI model.
Defines the population and calculation while keeping business approval with operations. One agreed measure does not establish governance of every metric or prove that service performance improved.
Evidence to keep: Approved definition, request grain, promised-date rule, SQL reconciliation and DAX measure history.
Adoption with a denominator
Before: Increased dashboard adoption by 200%.
After: Measured weekly use of the service dashboard among 32 provisioned operations leads; distinct authenticated viewers rose from 14 in the first complete week of May 2026 to 23 in the first complete week of June after the team’s rollout and training.
That is nine additional weekly viewers: about 44% to 72% of the same provisioned group. Viewing is not proof of a decision or financial benefit; training and other rollout changes happened together.
Evidence to keep: Usage-log query, eligible-user list, week boundaries, service-account exclusions and rollout dates.
Data grain and reconciliation
Before: Built accurate dashboards with SQL.
After: Reconciled the request-level SQL reporting view to operations’ weekly close, separating reopened requests from new requests and logging unmatched identifiers for source-owner review before refresh.
Shows the data issue, comparison and escalation. A reconciliation check is bounded by its sources and period; it does not establish that the upstream system is error-free.
Evidence to keep: View definition, request keys, weekly close extract, reconciliation output and exception-owner log.
Evidence of business use
Before: Drove business strategy with actionable insights.
After: Added an overdue-work drill-through by queue and age band; operations leads used the view in their Monday allocation meeting, and I recorded feedback on missing ownership fields for the next model revision.
Names an observable use and a subsequent reporting change. Meeting use is stronger than an unqualified impact claim, but does not attribute lower backlog or better service to the dashboard.
Evidence to keep: Meeting agenda, dashboard walkthrough, feedback notes and linked change request.
A reusable metric change
Before: Transformed reporting using advanced DAX.
After: Replaced report-specific open-work calculations with a shared DAX measure at the request grain; checked month-end totals against a saved SQL result and documented that reopened work follows the current status.
Names the calculation boundary and a cross-check. Advanced is not a substitute for explaining the model, and the chosen rule must match the business owner’s definition.
Evidence to keep: DAX change, status-history rule, test cases and saved comparison totals.
Enablement with inspectable scope
Before: Empowered everyone with self-service analytics.
After: Ran two guided Power BI sessions for dispatch coordinators using a practice dataset; wrote a filter guide showing refresh time, eligible requests and escalation steps for disputed totals.
Specifies the audience, material and limitations. Attendance does not equal sustained adoption, and a practice dataset does not demonstrate access to production data.
Evidence to keep: Session materials, practice-data provenance, filter guide, attendance record and follow-up questions.
Connect BI skills to the report’s data and users
A concise skills list should point to something the experience section or a project can explain. Put SQL and your actual BI platform first when relevant, then show the modeling, validation and communication work behind them. Power BI appears here because it belongs to Darius’s fictional record. It is not evidence that every BI analyst must also know Tableau, Looker, Python and every cloud warehouse.
Business intelligence skills and supporting evidence in the fictional example
Skill
Evidence to name
Sample connection
SQL
The reporting grain, joins, duplicate/status handling and comparison source.
The request-level view is reconciled to a weekly operations close.
Power BI and DAX
A named measure and the rule it implements.
The shared open-work calculation follows the current request status.
Metric definitions
Population, numerator, denominator, date basis, exclusions and approver.
Operations agrees the service-level attainment definition and canceled-request treatment.
Usage analysis
A viewer definition, eligible group, period and exclusions.
Distinct weekly viewers are compared among the same 32 provisioned leads.
Stakeholder collaboration
An observable reporting use and recorded feedback.
The overdue-work drill-through enters a Monday allocation meeting.
Enablement
Audience, learning material and follow-up limitations.
Two guided sessions use practice data and a filter guide.
The employer descriptions illustrate three reporting environments. Metergy covers business views and integrity across utility functions, including an early-career experience range. Fetch includes insurance reporting and semantic models. Metron emphasizes enterprise reporting, a report catalog and documented definitions. Requirements tied to insurance submissions, SSAS, citizenship or clearance eligibility belong to their specific vacancies. Check each description rather than treating the combined tools and conditions as an occupation-wide standard.
Write the summary around the reporting responsibility
Name the business function, tools and reporting responsibility you can support. Darius’s summary says service operations, SQL/Power BI, request-level models, reconciled totals and observed use. It does not claim to have transformed the organization or to be a data scientist. The dated roles provide the supporting examples.
For each job, explain the reporting problem before listing routine refreshes. A useful sequence is business rule, model or report change, check, and observed use. Keep actual titles and dates, and make the responsibility of finance, operations, data engineering or another owner clear. If applying at a senior level, add real scope such as approving changes to a shared measure, reviewing other analysts’ models or maintaining a report retirement process. Do not imply direct reports because you trained users.
A short project note can carry details that would overload a bullet: grain, source lineage, date rules, validation examples and known limitations. Share only permitted artifacts. A polished dashboard screenshot without the definition and data context gives a reviewer less to investigate.
Show a first BI project without inventing workplace adoption
An internship, reporting task or independent project can demonstrate the chain from source to measure to report. Keep the setting visible and make one calculation reproducible. You do not need to invent an executive audience or a cost saving to make a junior example concrete.
Illustrative early-career adaptation
Summary: Information-systems graduate pursuing a first BI analyst role, with a SQL and Power BI project using synthetic service-request data. Documents eligible records, reconciles totals and explains filter behavior to classmates.
Project bullet: Defined an overdue-request measure at one row per request, tested canceled and reopened examples against a hand-calculated table, and revised the Power BI filter instructions after a classmate walkthrough.
Boundary: The dataset and audience are part of a learning project. This demonstrates a method and feedback, not company-wide adoption, production permissions or a measured operational improvement.
Keep other work under its true title. An operations coordinator’s reconciled close sheet can be relevant transferable evidence; changing the title to BI analyst would obscure what happened. Put a strong project near the top if it explains more relevant work than your employment history.
Report degrees and credentials accurately
List the actual degree, field, institution and dates. Relevant coursework can help an early-career application when tied to a project. The fictional information-systems degree is one background, not the only route into BI. The cited employers use different degree and experience wording, so read the qualification section for the role you want.
Add a Microsoft, Tableau or other credential only if you hold it, using its actual issuer and current status. Mark preparation or study as in progress rather than certified. A credential can show learning; it does not prove that a reporting model is correct, that an access policy was tested or that users adopted a dashboard.
Check long contacts with Precision’s photo enabled
Only the email and portfolio contact URL change in this version. All work, definitions, dates and projects remain identical to the base sample. Precision is shown with a photo to expose the full contact strings alongside the identity area. Compare their final characters with the complete text, rather than assuming a neat header contains the whole address.
Business intelligence analyst supporting service operations with SQL and Power BI. Builds request-level reporting models, translates business rules into shared measures and reconciles dashboard totals with source owners. Tracks who uses reporting and how it enters a meeting, while distinguishing adoption from improved business performance.
Skills
SQL reporting views · Power BI and DAX · Request-grain modeling · Metric definitions · Data reconciliation · Dashboard usage analysis · Stakeholder enablement
Experience
Business Intelligence Analyst
Bracken Service Network · Field-service operations
February 2023–Present
Agreed a service-level attainment definition with operations: completed requests meeting the promised date divided by eligible completed requests; documented canceled-request exclusions and implemented the measure in a shared Power BI model.
Measured weekly use of the service dashboard among 32 provisioned operations leads; distinct authenticated viewers rose from 14 in the first complete week of May 2026 to 23 in the first complete week of June after the team’s rollout and training.
Reconciled the request-level SQL reporting view to operations’ weekly close, separating reopened requests from new requests and logging unmatched identifiers for source-owner review before refresh.
Added an overdue-work drill-through by queue and age band; operations leads used the view in their Monday allocation meeting, and I recorded feedback on missing ownership fields for the next model revision.
Reporting Analyst
Pinebend Dispatch Services
June 2020–January 2023
Replaced report-specific open-work calculations with a shared DAX measure at the request grain; checked month-end totals against a saved SQL result and documented that reopened work follows the current status.
Ran two guided Power BI sessions for dispatch coordinators using a practice dataset; wrote a filter guide showing refresh time, eligible requests and escalation steps for disputed totals.
Education
B.S. in Information Systems · Westhaven College
August 2016–May 2020
Projects
Service reporting definition register
Internal BI contributor · Bracken Service Network
July 2025–September 2025
SQL · Power BI · DAX
Recorded the grain, eligible population, date basis and business owner for the service-level attainment measure. Linked the approved wording to the SQL reconciliation and shared DAX calculation, with a change log for reopened and canceled request treatment. The register captures agreed rules rather than asserting that one definition fits every business.
The expanded version preserves every base field and adds an earlier operations-reporting internship plus two dated projects. Precision is shown without a photo. Read the dashboard-use definition, the last reconciliation-pack sentence, the internship and each URL across all exported pages. Nothing was removed to force a page count.
Open page 1 at full sizePrecision · Page 1 of 3 · Photo off · Complete paid-plan PDF page, including margins, without a watermark.Open page 2 at full sizePrecision · Page 2 of 3 · Photo off · Complete paid-plan PDF page, including margins, without a watermark.Open page 3 at full sizePrecision · Page 3 of 3 · Photo off · Complete paid-plan PDF page, including margins, without a watermark.Use Precision without a photo
Business intelligence analyst supporting service operations with SQL and Power BI. Builds request-level reporting models, translates business rules into shared measures and reconciles dashboard totals with source owners. Tracks who uses reporting and how it enters a meeting, while distinguishing adoption from improved business performance.
Skills
SQL reporting views · Power BI and DAX · Request-grain modeling · Metric definitions · Data reconciliation · Dashboard usage analysis · Stakeholder enablement
Experience
Business Intelligence Analyst
Bracken Service Network · Field-service operations
February 2023–Present
Agreed a service-level attainment definition with operations: completed requests meeting the promised date divided by eligible completed requests; documented canceled-request exclusions and implemented the measure in a shared Power BI model.
Measured weekly use of the service dashboard among 32 provisioned operations leads; distinct authenticated viewers rose from 14 in the first complete week of May 2026 to 23 in the first complete week of June after the team’s rollout and training.
Reconciled the request-level SQL reporting view to operations’ weekly close, separating reopened requests from new requests and logging unmatched identifiers for source-owner review before refresh.
Added an overdue-work drill-through by queue and age band; operations leads used the view in their Monday allocation meeting, and I recorded feedback on missing ownership fields for the next model revision.
Reporting Analyst
Pinebend Dispatch Services
June 2020–January 2023
Replaced report-specific open-work calculations with a shared DAX measure at the request grain; checked month-end totals against a saved SQL result and documented that reopened work follows the current status.
Ran two guided Power BI sessions for dispatch coordinators using a practice dataset; wrote a filter guide showing refresh time, eligible requests and escalation steps for disputed totals.
Operations Reporting Intern
Pinebend Dispatch Services
June 2019–August 2019
Compared weekly dispatch exports with a supervisor’s close sheet and recorded missing request identifiers for review.
Prepared Excel pivot tables by queue using a copy of the reporting extract approved for the internship.
Documented the extraction date and status filters so the reporting analyst could reproduce the table.
Education
B.S. in Information Systems · Westhaven College
August 2016–May 2020
Projects
Service reporting definition register
Internal BI contributor · Bracken Service Network
July 2025–September 2025
SQL · Power BI · DAX
Recorded the grain, eligible population, date basis and business owner for the service-level attainment measure. Linked the approved wording to the SQL reconciliation and shared DAX calculation, with a change log for reopened and canceled request treatment. The register captures agreed rules rather than asserting that one definition fits every business.
Defined a weekly viewer as a distinct authenticated person who opened the service dashboard, excluding service accounts and test access. Compared the same 32 provisioned leads in two complete weeks and kept the denominators beside the counts. Reviewed the usage results with operations after training. The comparison does not show that viewing changed a decision, isolate the effect of training or establish a financial return.
Built a small set of request histories covering closure, reopening and cancellation to check the shared open-work rule. Matched the DAX total to a saved SQL result for the same reporting date and preserved exceptions for the source owner. Documented that the report uses current status rather than every historical status event, so readers could understand why a historical close extract might differ. No claim was made that the source data was universally complete.
This longer version tests the layout; it is not a suggestion to include every task in a real application. Select relevant evidence first. Preserve a rate’s denominator and essential exclusions when editing, and check whether the remaining work is still understandable at normal reading size.
Validate the downloaded resume before submission
Read all pages, including the narrow skills area, date ranges and final project line. Check any page transition that separates a measure from its context.
Copy the PDF text into a plain document and inspect order, particularly Precision’s and Clarity’s columns. Open every portfolio and project link.
Use the file format the employer requests. Review the contact, title and date fields populated after upload; no visual template guarantees correct parsing.
Recheck metric arithmetic, population, period and ownership. Remove private records and ensure that portfolio material is approved or clearly synthetic.
Review your BI resume with the analyzer and judge its suggestions against the work you can support. The Use buttons open signup with the chosen template and photo preference. Free-plan PDF downloads include a watermark; the previews show paid-plan output.
Questions, answered
How is this different from a general data analyst resume?
This example emphasizes recurring reporting: shared definitions, model checks, a BI platform and documented dashboard use. Data analyst roles can overlap. Keep your actual title and adapt the evidence to the specific vacancy rather than assuming every BI role includes predictive modeling.
Is a count of dashboards enough to show impact?
It shows delivery volume when accurate, but says little about use or correctness. Add the audience, business rule, reconciliation or observed use you can substantiate. A dashboard view is not by itself a financial or operational result.
How should I report dashboard adoption?
Define a viewer or user, the eligible group, time period and account exclusions. Compare equivalent periods and populations. Distinguish views, training attendance and actual decision use, and do not attribute business improvement to a rollout without supporting evidence.
Can I use synthetic data in a BI portfolio?
Yes, if you label it clearly and explain the source or generation method, grain, assumptions and checks. It can demonstrate SQL and reporting methods. It cannot substantiate real employee adoption, customer results or a former employer’s performance.
Do I need a certification and every BI platform listed?
Follow the particular vacancy and list the tools and credentials you actually hold or use. Explain a concrete model or measure. A long platform list or a course certificate cannot replace evidence of reporting work.
Does signup retain the chosen design and photo preference?
The Use buttons pass that design and the current photo choice through account signup to the builder. The fictional resume and portrait are not inserted. An account is required; free-plan PDF downloads include a watermark.
Prepared by Resumize with AI-assisted research and drafting for English-language US applications. We checked the three primary employer descriptions and CareerOneStop guidance below on October 27, 2026. Each employer description offered an application form or linked application form; publication dates were not shown and availability can change. These illustrate distinct business reporting contexts, not universal entry requirements. The fictional resume, rewrites and measurement critique are original editorial examples, not employer endorsements.
Long Island City, New York, hybrid. Checked October 27, 2026: description and linked application form available; publication date not shown. Covers business views, SQL, data integrity and reporting across utility functions. Its 0–2 year experience range and preferred tools are employer-specific.
Remote US. Checked October 27, 2026: application form available; publication date not shown. Covers channel reporting, semantic models and data quality. Insurance submissions, SSAS Tabular and AI enablement reflect this employer’s context rather than universal BI requirements.
Reston, Virginia. Checked October 27, 2026: application form available; publication date not shown. Covers report catalog maintenance, metric documentation and end-user support. Citizenship and clearance eligibility are specific to this position, not to BI work generally.
Read October 27, 2026. General guidance on readable layouts, dated history, standard headings and checking the requested file format. Its preference for simple single-column layouts informs our export checks; no design here has a universal parsing guarantee.
Read October 27, 2026. Supports relevant actions, work context and transferable evidence. The fictional employers, measurements and annotated rewrites are original Resumize editorial work.
Read October 27, 2026; occupation page marked updated 2026. Includes periodic reporting, maintaining BI tools, documenting specifications and testing against defined needs. Describes occupation scope, not a universal software or certification checklist.